
Go Advent Day 2 - Go 1.2 performance improvements
Introduction
7 months, 1600 changes, well over 350 issues closed¹, and Go 1.2 is done.
Go and install it now – it’s ok, it only takes a few minutes – I’ll wait.
When Go 1.1 was released earlier in the year I did a series of posts (part 1, part 2, part 3) exploring the performance improvements the then current released provided. Go 1.1 was a herculean development effort, stretching some 14 months, and it brought with it equally impressive performance improvements.
This time around, Go 1.2 was a 7 month development effort with a fixed delivery date announced up front. Contributors spent 3-4 months landing improvements before a 3 month feature freeze.
Of course, shorter cycles mean less scope for performance improvement, but as we shall discover, Go 1.2 has not failed to deliver.
¹ Go 1.2 Closed issues – the real number is probably higher; many issues are closed without being tagged for the release they are fixed in.
The top line number
A widely quoted figure for the Go 1.1 performance improvements was 30-40%. As Go matures it becomes harder to find big performance gains, and it is just as difficult to summarize them in a single sentence. To find out more, read on.
Performance headlines
This section highlights some of the major improvements that landed in Go 1.2.
8kb stack segments
Since the earliest days of Go, each goroutine has allocated stack segments in units of 4096 bytes. Being equal to the operating system page size made this a sensible default, but it had been known for some time that for code which was recursive or contained inner loops of long call chains (most of the encoding/* packages fall into this category) stack splitting, or stack straddling was a significant cause of slowdown and benchmark instability.
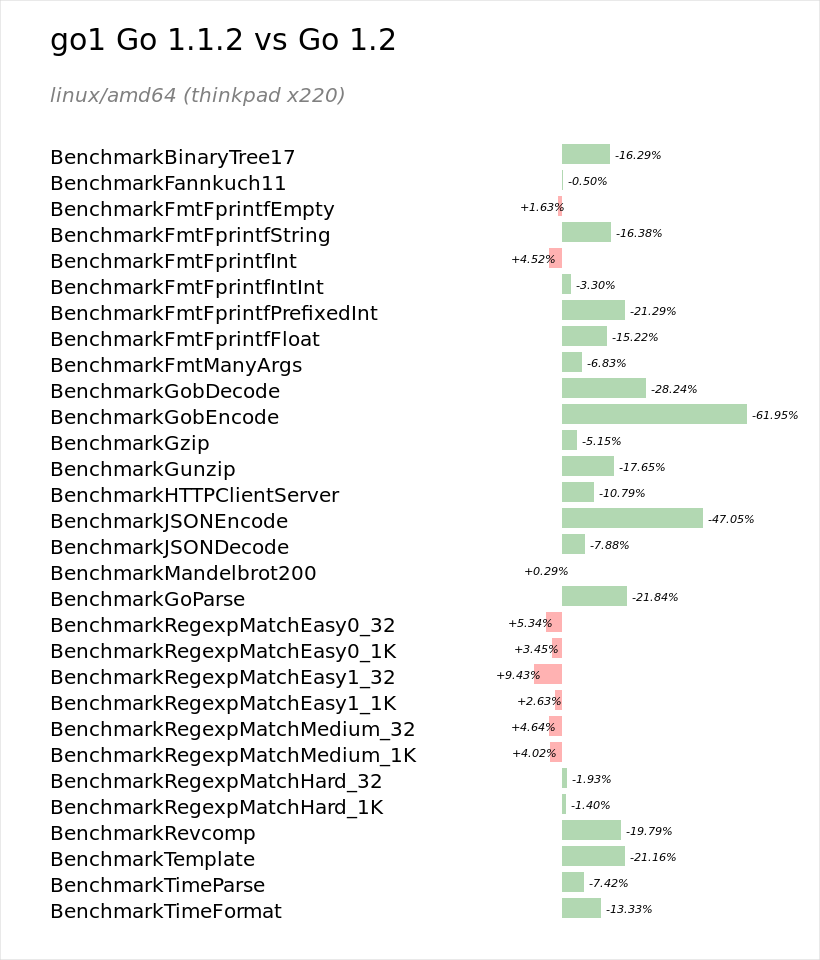
In October Russ Cox proposed doubling this value to 8k and presented a detailed analysis to support this change. This one change boosted many of the Go 1 benchmarks by 10%, but the main clue that this was the right decision was that the infamously unreliable JsonEncoder benchmark became stable and predictable.
Russ’s data demonstrated that the original 4k stack size was wrong, and as it had been chosen without empirical evidence, it was a number which could not be defended. However, increasing the granularity by which goroutines allocate memory from the operating system has a cost. The tradeoffs of this change are discussed in the final section of this article.
Preemption
Prior to Go 1.2 a single goroutine could hog the entire CPU if it ran in a tight loop. The effect of this CPU hogging is well known for programs which run with the default value of GOMAXPROCS but it has a more subtle effect on garbage collection performance.
When a garbage collection is requested the first action the GC takes is to stop the world; i.e. ask, then wait, for all goroutines to return to the scheduler. A single running goroutine can delay the stop the world phase, theoretically indefinitely, if it is performing a CPU intensive operation.
To solve this problem a check is added to the preamble of every function entry allowing the garbage collector to halt running goroutines faster, lowering the overall time for a GC cycle.
The Go 1.2 release notes have more information on this feature and its limitations.
Integrated network poller
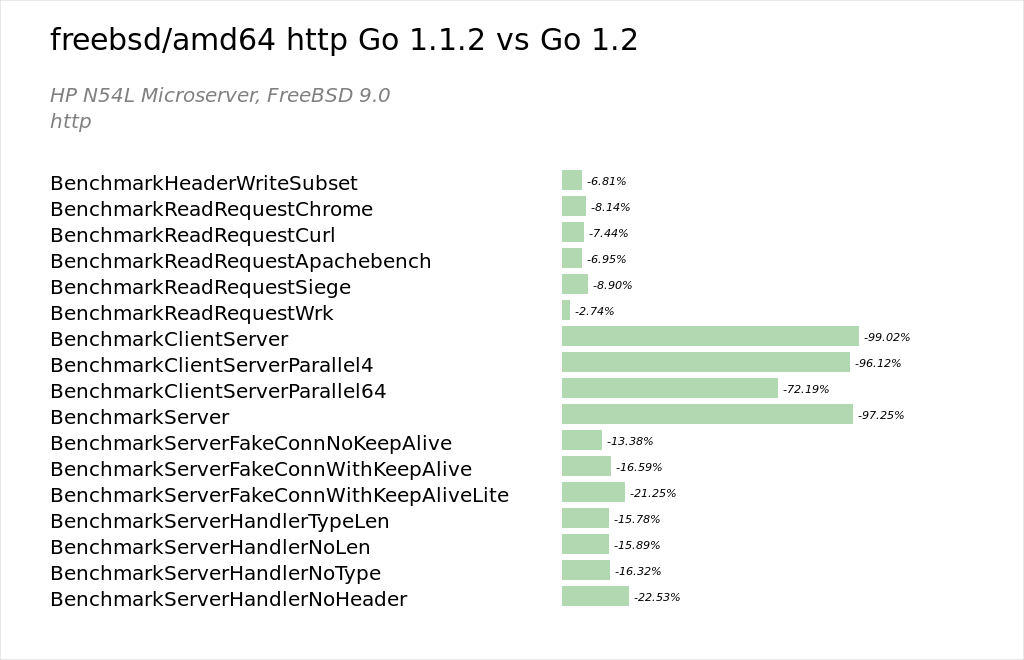
The work that was started by Mikio Hara, Alex Brainman and Dmirty Vyukov in 1.1 integrating the the network polling subsystem directly into the runtime was completed for Windows and the BSD family. All platforms now use the integrated network poller. This has also resolved the freebsd/amd64 regression noted during Go 1.1.
Garbage collector improvements
A large amount of work tool place during the 1.2 cycle to further improve the performance of the garbage collector.
While the garbage collector is not yet completely precise, its precision has improved over Go 1.1, which itself was a major improvement over 1.0.
Improving the precision of the garbage collector means fewer values on the heap are mistaken for pointers. This has the direct result that the heap is smaller. A smaller heap leads to lower garbage collection time overall as well as lowering the memory footprint of Go programs. A fully precise garbage collector is also required to deliver features like contiguous stacks (see below) or a compacting garbage collector.
Sadly, many of the improvements are not enabled by default as they was not ready in time for the September 1 feature freeze. Finishing this work is a major focus of the 1.3 development cycle.
Faster primitives
In my previous series on Go 1.1 I showed large data sets from the runtime package benchmarks. This time around I’m going to focus only on some key improvements.
Memmove improvements
For Intel platforms Keith Randall landed a change shortly after the 1.2 tree opened that improved small memmove operations, and thus copy, significantly.
1 2 3 4 5 6 7 8 9 10 11 12 13 14 15 |
# linux/amd64 benchmark old MB/s new MB/s speedup BenchmarkMemmove32 1405.39 5462.62 3.89x BenchmarkMemmove4K 22415.16 23127.08 1.03x BenchmarkMemmove64K 18583.10 18477.46 0.99x BenchmarkMemmove4M 5182.82 5171.82 1.00x BenchmarkMemmove64M 5159.03 5170.81 1.00x # linux/386 benchmark old MB/s new MB/s speedup BenchmarkMemmove32 400.89 942.76 2.35x BenchmarkMemmove4K 3014.72 3088.95 1.02x BenchmarkMemmove64K 1871.83 1875.65 1.00x BenchmarkMemmove4M 889.91 890.49 1.00x BenchmarkMemmove64M 882.89 888.91 1.01x |
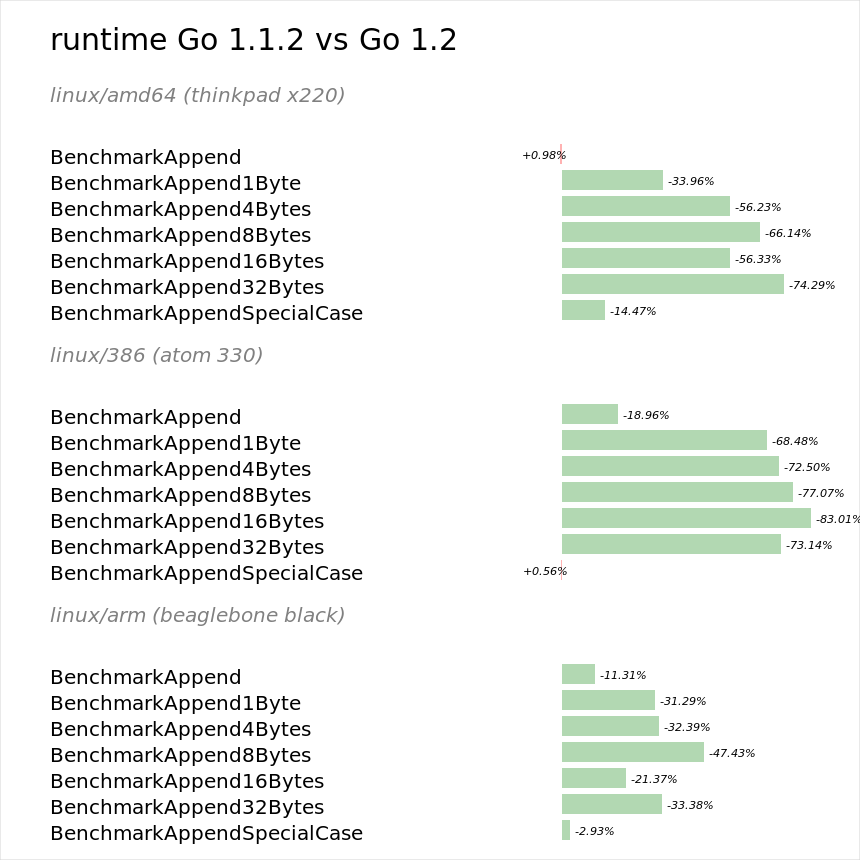
Faster append
The append built-in function was improved in Go 1.1 by Rob Pike to reduce its overhead when being called on slices with a small number of elements, a common operation.
During 1.2 this was improved further by Rémy Oudompheng who moved the append operations into the compiler, thus further reducing their overhead.
Unified strings and bytes primitives
In Go 1.1 bytes.IndexByte and bytes.Equal received assembly versions for all three architectures which improved their throughput. In Go 1.2 this was improved further by unifying their operation with their counterparts in the strings package.
Cypto and compress improvements
One area where Go continues to lag is the performance of its crypto libraries.
During the cycle Nick Craig-Wood contributed a number of faster crypto primatives for arm (and I’m told more is to come).
Rémy Oudompheng significantly improved the speed of crypto/des and contributed major speedups to compress/flate and compress/bzip2
Real world improvements
As Release Candidates started to arrive in September I took some time to brush the cobwebs off autobench and put out a call for benchmark contributions. Along the way new benchmarks were contributed from external Go libraries which give an important view on the performance improvements Go 1.2 brings to code outside the standard library.
Megajson performance
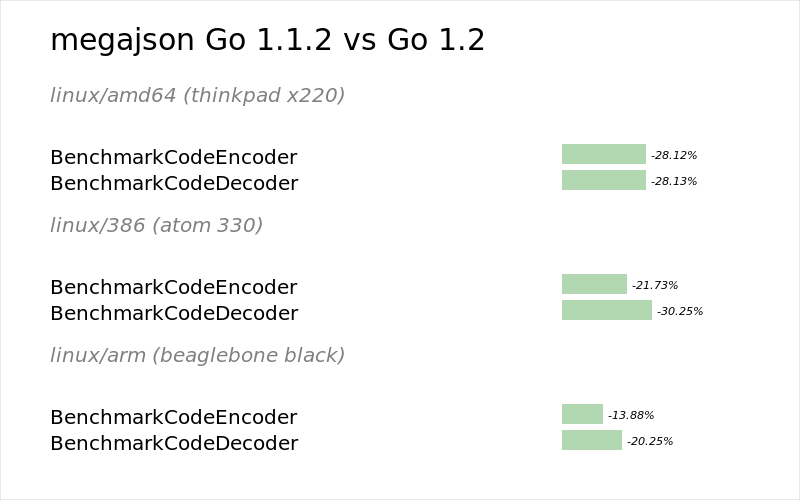 Ben Johnson’s Megajson package shows a 15-30% improvement over Go 1.1.2.
Snappy performance
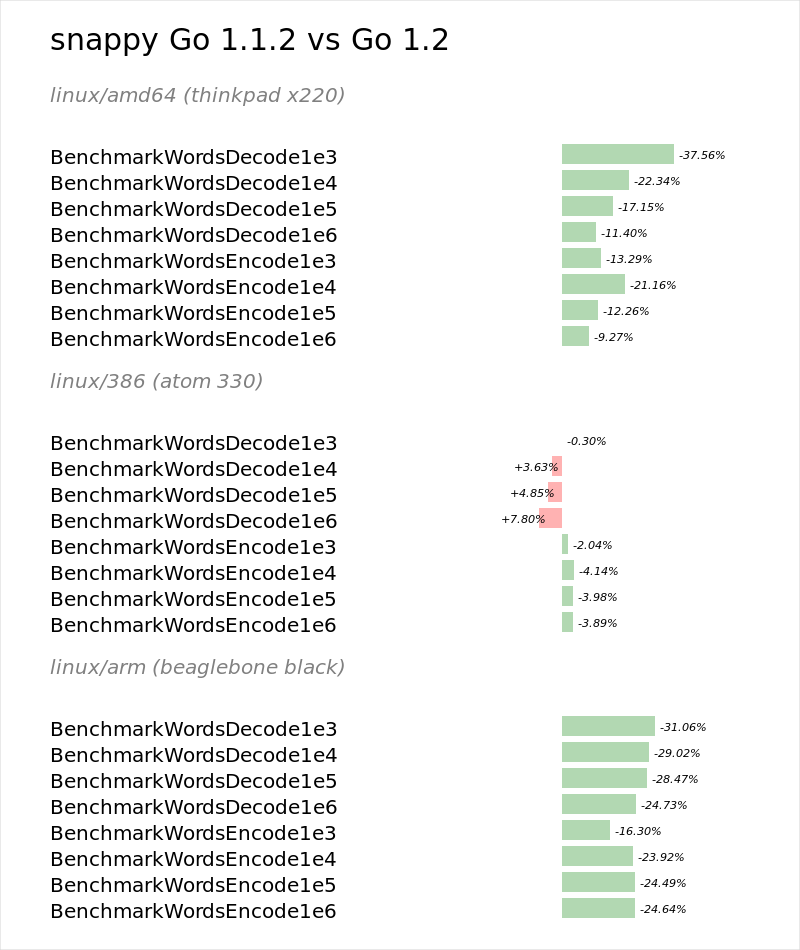 Snappy benchmarks show a big improvement on amd64 and arm platforms under Go 1.2. Oddly there is no improvement for 386.
These images are generated by AJ Starks’ great benchviz tool.
Wrapping up
So, does Go 1.2 deliver on the expectation of performance junkies ? In a word, yes.
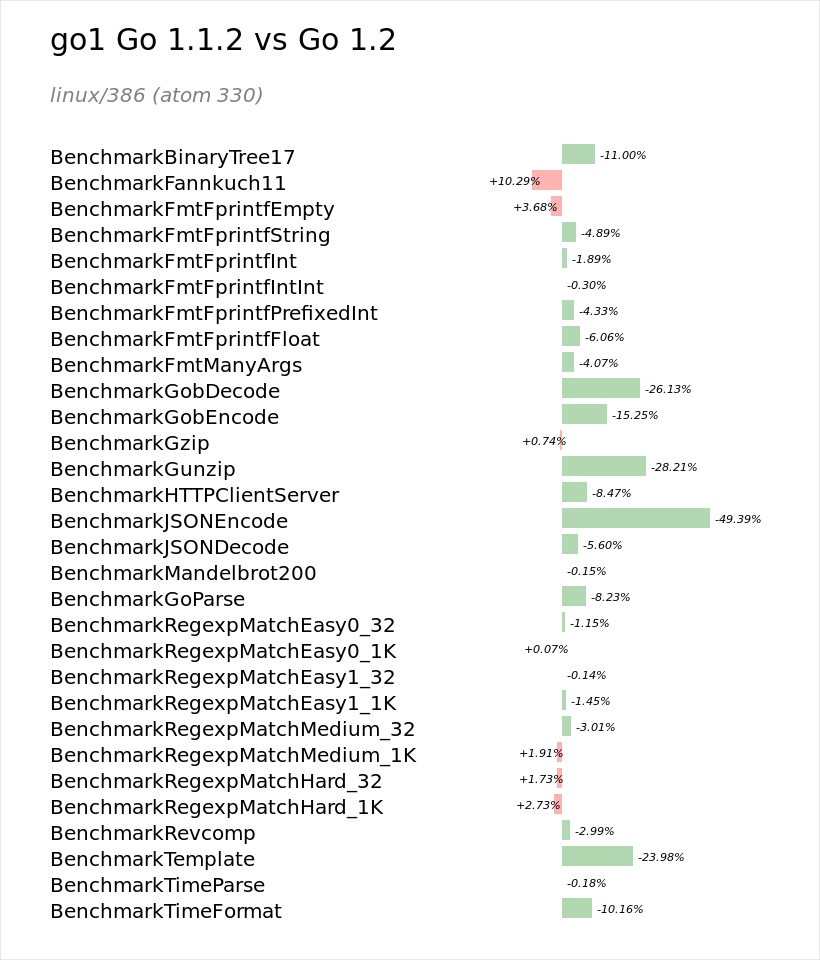
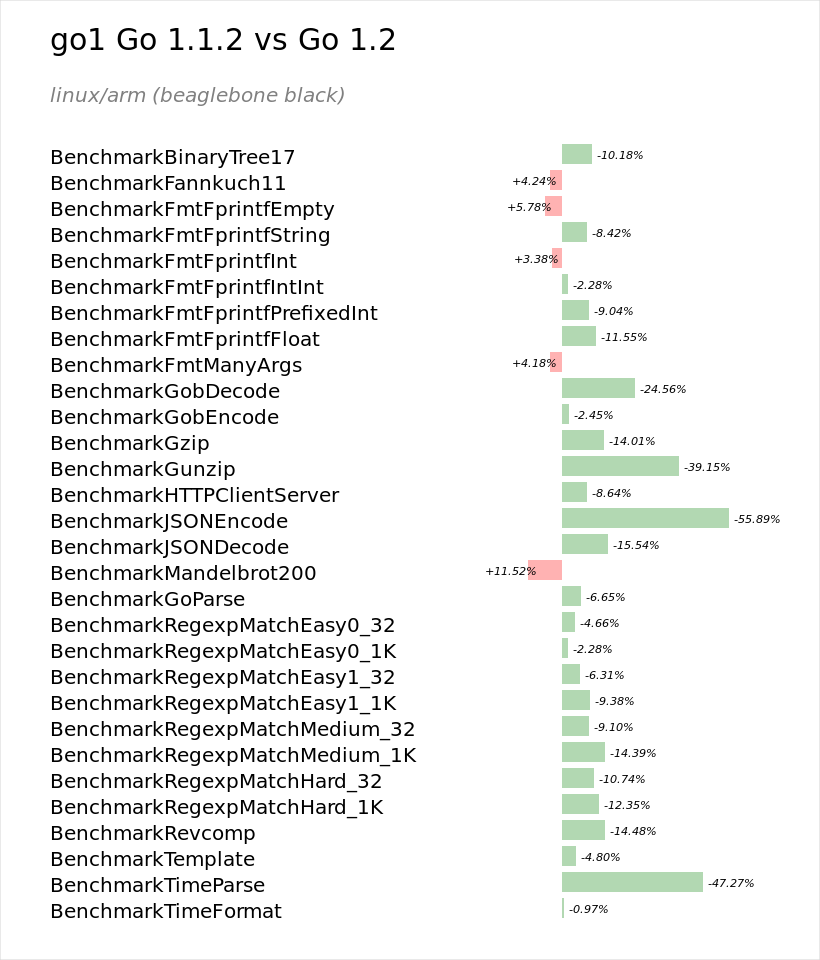
A shorter development cycle and fewer low hanging fruit meant that developers had to work harder to find performance gains. For 64 bit Intel platforms the gains appear to be in the 15-20% range for real world code. For the other 32bit platforms, the gains are more modest, around 10%.
Looking forward to the 1.3 development cycle
Planning for the 1.3 cycle has been underway for a month now. Rob Pike opened the discussion on the 2nd of November with this thread out of which came a document identifying the major items for this cycle. Russ Cox has also provided a dashboard to track the progress of 1.3.
Dmitry Vyukov has announced a performance dashboard which will track a slew of measurements for each commit. The dashboard is currently running on a temporary url but is expected to be integrated into the main CI dashboard soon.
There is also a renewed focus on toolchain performance. We picked up a 30% speedup in compilation time in 1.1, but have lost most of that over the 1.2 cycle.
Russ Cox has proposed some wide ranging changes to the linker which will move more work to the compiler, thus becoming parallisable. Russ has published a document with his plans for a revised linker in 1.3.
Similarly the size of final Go executables, while never svelte, have been rising steadily for some time now, so work will be done to understand and reverse this trend.
Lastly, although Russ’s work in raising the stack segment size to 8kb bought an important performance improvement, it did so at the cost that each goroutine now needs at least 8kb of stack space. For some applications that were happy with the original 4kb stack size, this is overkill, and depending on the sophistication of your operating system’s virtual memory subsystem may lead to a larger memory footprint.
To resolve this Keith Randall has proposed moving the runtime to use contiguous stacks. Segmented goroutine stacks will grow and shrink as required without the high cost of straddling the stack segment boundary. Interestingly the Rust project developers have come to the same conclusions and are also moving to a contiguous stack model.