
Tracking the Stars
In April 2017, I thought it would be fun to try setting up a system to track the star counts of the top 1000 Go repositories on GitHub. This article describes how I collected this data and some simple analysis of the dataset.
I want to be clear that this was for fun only and I’m not advocating that the number of stars a repository has is the be-all-end-all of its success. There’s many, many repositories I am not mentioning here that are high quality, useful code. There’s also tons of code that lives in private repositories outside GitHub or on Bitbucket and GitLab. In the context of this article, the stars on GitHub are a set of data used to explore the patterns people have when starring repositories.
Collecting the data
The collection of the stars could be an article all its own (and may become one elsewhere) so I will be brief.
The collection is done by a Lambda function on Amazon Web Services using a timer that triggers an execution every 15 minutes. The lambda function collects the star count of the top 1000 Go repositories, which is the maximum the GitHub search API will return. This is a post about Go, so the lambda function is written in… Python, of course! The total resource usage is well below the free tier limits, so running this function is free indefinitely.
The data that the lambda function collects is stored in a DynamoDB table that just holds the repo name, an integer timestamp (epoch time in seconds), and the number of stars at that time. By the time this article was started, I had several hundred megabytes of data in DynamoDB. As with the Lambda function, the usage here is below the free tier limit, so the storage is free as well. For reference, the allocated read and write capacity is 20 units each.
To get the data out of DynamoDB, I used the standard AWS Data Pipeline template. The AWS Documentation covers the process well. From there, I had to download it all locally using the AWS CLI and then write a program (this time in Go) to convert the many separate chunk files into one CSV file. This left me with a 726 MB CSV file.
The go program to do the CSV conversion is incredibly over-engineered, but it was fun to optimize while the next step completed.
I decided that a real database was going to be helpful in doing the analysis, so I set up Postgres
locally and imported the giant CSV file into a table. The following is the schema and command to
copy the CSV data into Postgres. This would be run at the psql command line.
|
|
Let’s dig in
At the end of this (lengthy) import I was left with a relatively simple table that has 23,279,479 rows of data about 1412 separate repositories. Note that this number isn’t easily divided by 1000. That’s because the error handling was not extremely robust in the lambda. It’s designed for long term trends, not second-by-second updates. The number of tracked repositories is higher than 1000 because some repositories stayed the same and slipped out of view as others increased. Yet others increased rapidly from 0 to attain a relatively high position in the middle of tracking.
Total stars per repo
I started by looking at the distribution of total stars per repository. Getting the number of stars for each repository at the end of the sample period (for that repository) was fairly straightforward (but also fairly slow). The graph is the ordered list from rank 1 on down.
|
|

Total star gain
All of the repositories in the tracked set gained a total of 533,614 stars over the tracking period. This was done by finding the min and max timestamp for each repository, getting the star counts at those times, finding the difference, and then summing all those differences.
|
|
Rate of star count increase
Through some SQL-fu I produced the sorted list of repositories by the number of stars they collected per day during the time they were tracked. Hold on to your hat for this SQL statement:
|
|
This produced a distribution much like others you see with this kind of data; there’s a few repositories in the fat section of the graph with the majority of the rate increase with a long tail of repos that are slowly increasing. There is one unfortunate repository that had a -24 out there at the end.

Do bigger repositories grow faster?
I wanted to figure out if the larger repositories grow faster than smaller ones, so I grabbed the number of stars at the end of the tracking period for each repository and charted that against the number of stars increase per day. The SQL this time is a small tweak to the last one:
|
|

Yes! they do, generally. Some smaller repositories have a higher rate, but the larger ones (for which there’s less data) are definitely trend higher. To make the data a little easier to see, a log scale can be used on both axes. There’s a definite split between the top repositories and the bottom ones.

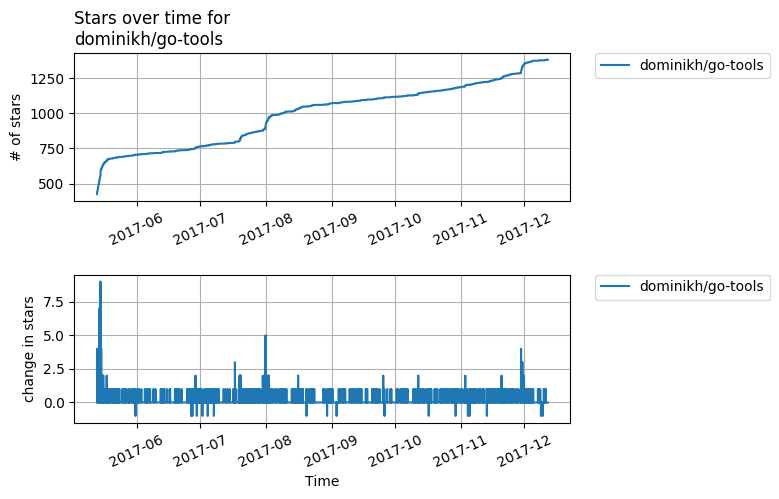
Single Repository Graphs
One of the first things I did early on was to create a python script that pulls the data for any number of repositories and graph it using matplotlib. The details are can be found in the Python code, but the graphs are fun to look at:
External Effects
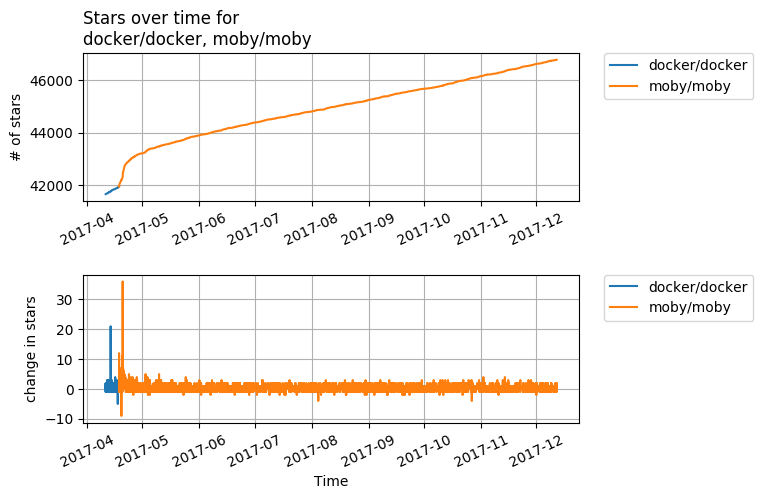
One of the more interesting things is seeing how external events can affect individual repositories greatly in the short term. Most projects have short-term jumps in star counts based on blog posts or other external events, like a talk at Gophercon or inclusion in one of the newsletters. That’s mostly speculation, I didn’t spend the time to do correlation.
Case in point: The first graph clearly shows a sharp rise in star count for moby/moby just after
the name change from docker/docker and then a pretty linear rise after that.
Conclusions
- Bigger repositories do grow faster. There seems to be an inflection point around 5000 stars.
- Smaller repositories can also grow fast. The fastest were in the middle of the pack below the inflection point.
- Every project is different. Some will be stable and get less press and therefore grow less. Others are constantly being talked about.
Data
The final collected data (as of this writing) is 23,279,479 rows and over 750 MB raw and 100 MB gzipped. Unfortunately, the data is too big to just toss up on a website for download. I have provided all of my source code in links above, though, so anyone could easily set this up.
What next?
I haven’t turned it off, so in the time it took to read this article it’s likely collected another measurement. I plan on leaving it on for as long as I can. I also will likely adjust the lambda function to collect more kinds of data about the people starring repositories. I think looking at the groupings of repositories by people who starred them can uncover similarities between them, or at least show what kinds of things a given user is interested in.
If you’re interested in doing this kind of tracking (or just like playing with data), grab all the code linked above and start it running in your own AWS account. It’s (almost) free and you can have fun playing with the output. If anyone wants the source data or has any other questions, you can contact me on twitter or by email. Let me know what you thought and if you have ideas on what to do with all this data, let me know.
Twitter: @sgmansfield
GitHub: ScottMansfield
Email: sgmansf@gmail.com