The Other Side of Go: Programming Pictures, the Read, Parse, Draw Pattern
The other side of Go: Programming Pictures, the Read, Parse, Draw Pattern
Go has proven to be extremely versatile and well suited to back-end tasks, but sometimes you need a picture, and I’ve found that Go works well for generating visuals as well. This post will explore one method for generating pictures (specifically vector graphics) from data using the SVGo package.
The SVGo package API
performs a single function: generate standard
SVG to an io.Writer. Because of Go’s
flexible I/O package, your pictures can go anywhere you need to write:
standard output, files, network connections, and in web servers.
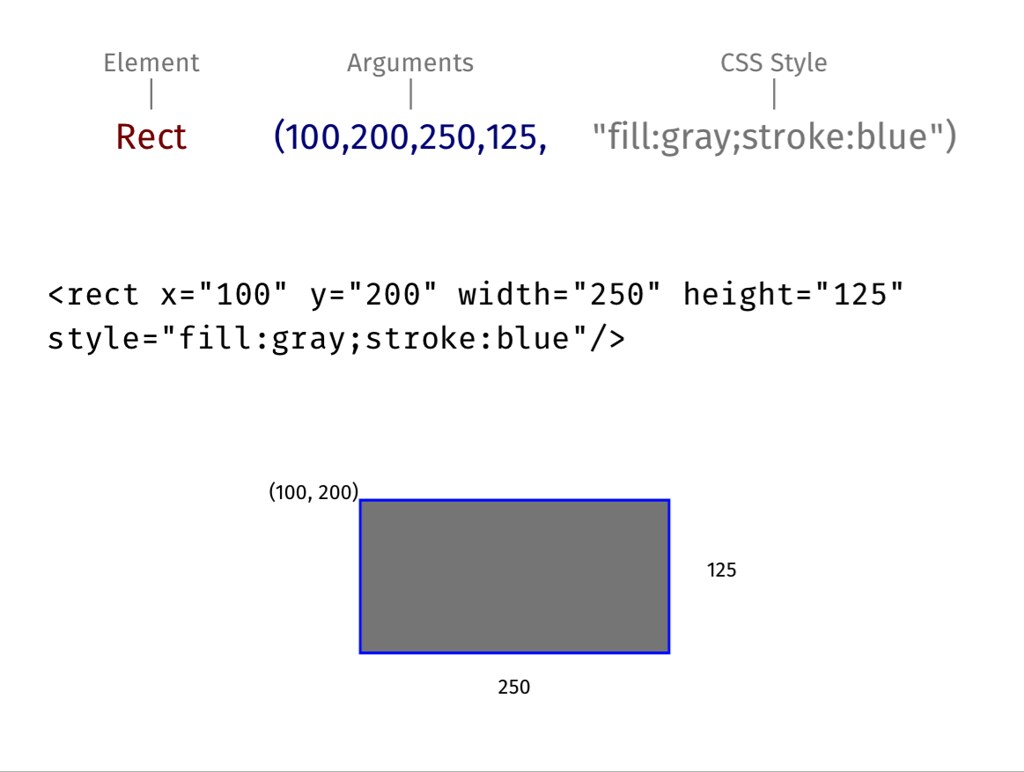
SVGo is designed so that programmers can think in terms of high-level objects like circles, rectangles, lines, polygons, and curves, using the program’s logic to manage layout and relationships, while applying styles and other attributes to the objects as needed.

The read/parse/draw pattern
One pattern for generating pictures from your own or Internet sources is the read/parse/draw pattern. The pattern has these steps:
- Define the input data structures and destination
- Read the input
- Parse and load the data structures
- Draw the picture, walking through the structures
Here is a simple example that takes data from XML (using JSON is very similar), and creates a simple visualization in SVG to standard output. Note that for your own data you are free to define the input structure as you see fit, but other sources like Internet service APIs will define their own structure.
Given the XML input (thing.xml).
|
|
First we define the data structures that match the structure of our input. You can see the correspondence between the elements and attributes of the data with the Go struct: A “thing” has a top and left location that defines the drawing’s origin, along with an attribute that defines the separation between elements. Within the thing is a list of items, each one having a width, height, name, color, and text.
|
|
Specify the destination for the generated SVG, standard output, and flags for specifying the dimensions of the canvas.
|
|
Next, define a function for reading the input:
|
|
An important function is to parse the and load the structs —this is
straightforward using the XML package from Go’s standard
library: Pass the io.Reader to NewDecoder, and Decode into the
thing.
|
|
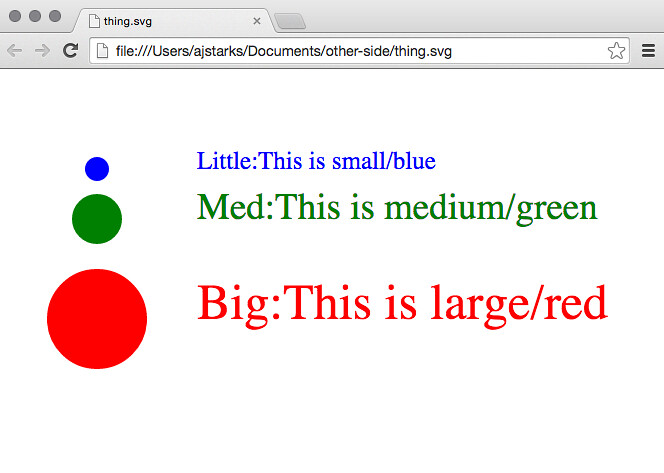
Finally, once you have the data loaded, walk the data, making the picture. This is where you use the higher-level functions of the SVGo library to make your visualization. In this case, set the origin (x, y), and for each item, make a circle that corresponds to the specified size and color. Next add the text, with the desired attributes. Finally, apply vertical spacing between each item.
|
|
The main program kicks things off, reading the input file from the command line:
|
|
running the program sends the SVG to standard output
1 2 3 4 5 6 7 8 9 10 11 12 13 |
$ go run rpd.go thing.xml
<?xml version="1.0"?>
<!-- Generated by SVGo -->
<svg width="1024" height="768"
     xmlns="http://www.w3.org/2000/svg"
     xmlns:xlink="http://www.w3.org/1999/xlink">
<circle cx="100" cy="100" r="12" style="fill:blue"/>
<text x="200" y="100" style="font-size:25px;fill:blue">Little:This is small/blue</text>
<circle cx="100" cy="150" r="25" style="fill:green"/>
<text x="200" y="150" style="font-size:37px;fill:green">Med:This is medium/green</text>
<circle cx="100" cy="250" r="50" style="fill:red"/>
<text x="200" y="250" style="font-size:50px;fill:red">Big:This is large/red</text>
</svg> |
When viewed in a browser, it looks like this:

Using this pattern, you can build many kinds of visualization tools; for example in my work I have tools that build conventional things like barcharts and bulletgraphs , but also alternatives to pie-charts, roadmaps, component diagrams, timelines, heatmaps, and scoring grids.
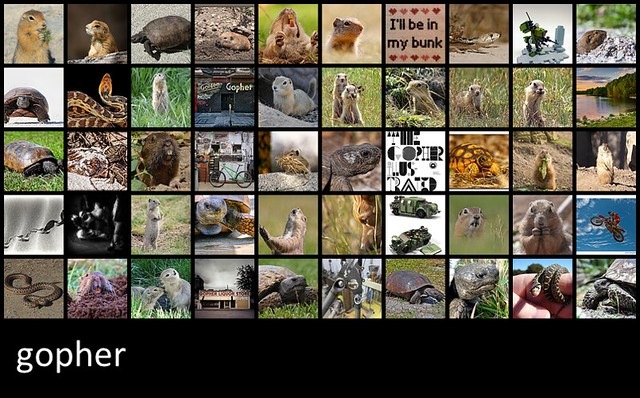
You can also generate data from Internet APIs as well. For example, the “f50” (Flickr50) program takes a keyword and generates a clickable grid of pictures chosen by Flickr’s “interestingness” algorithm. f50 uses the same pattern as above, but instead of reading from files, it makes a HTTPS request, parses the XML response, and makes the picture.
1
|
$ f50 sunset |
Generates this response:
|
|
The f50 program uses the id, secret, farm, server and title attributes to build this picture.
|
|

If you view the resulting SVG in a browser, and hover over a picture, you can see the title, and click on it to get the larger image.
