
Using Go for Anomaly Detection
As engineers, we need to know how our applications and services are performing in realtime and isolate any problems as quickly as possible. While there is a plethora of tools to collect, store and graph metrics from infrastructure, there are fewer tools for performing analysis on these metrics.
Anomaly detection, currently a hot topic in web operations circles, is concerned with automated detection of anomalous circumstances which could indicate a problem. Here we look at implementing a simple anomaly detection tool, anode, in Go.
One of the reasons anomaly detection is increasing in popularity is that static alert thresholds, although useful in many circumstances, sometimes fall short. For example, if your frontend load balancer normally handles 10 req/s and that drops to zero, something is likely to be wrong.
But the situation isn’t always so clear. Generally you will have expected error rates across your application stack, an expected latency profile, and so on. Configuring effective static alerts for these types of metrics can be difficult. If you have false positives, you’ll interrupt your on-call engineer’s work, or worse, their sleep. False negatives are arguably even worse — not knowing when something is wrong is clearly unacceptable.
To give an overall picture of health, it’s common to have various dashboards to show how your infrastructure and applications are behaving. But this relies on someone watching the dashboard, and it can be tricky to derive information when you have hundreds of metrics per node and hundreds or thousands of nodes.
One improvement to the situation is having an automated system to detect significant changes in metrics. The core requirement of such a system is to take an input metric, perform some analysis on it, and produce an output. When a metric goes outside its normal bounds, it can be said to be anomlaous, or at least worthy of further investigation. There are already interesting projects in this area, like Etsy’s skyline.
If you’re just learning about anomaly detection, I’d really recommend watching Simple Math for Anomaly Detection from Monitorama PDX 2014.
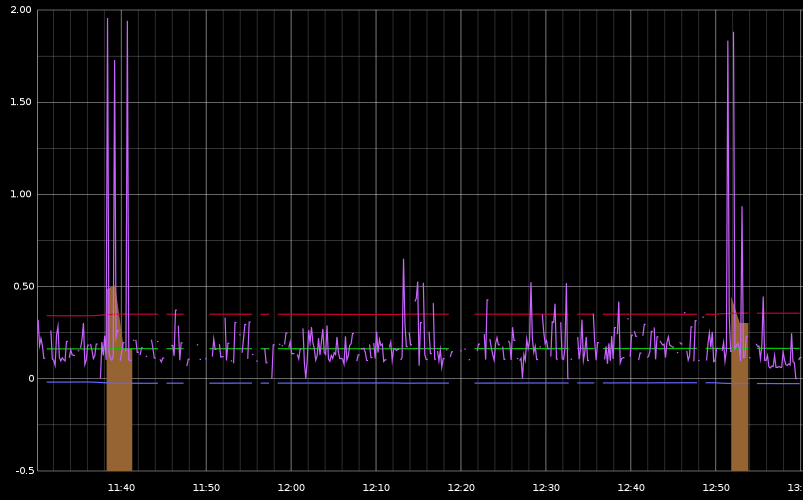
Below is a screenshot (of graphite) showing anode in action. The purple line is the response time of an application. The orange highlights are a result of passing that metric to anode which then produces a new graphite metric.
Design and Implementation
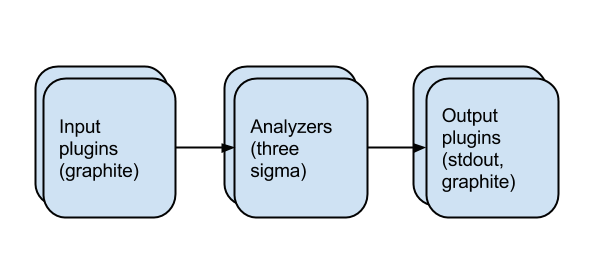
The design of anode is simple. We have input plugins, which take an input metric and place each new value on a channel. Analysis plugins receive these values and perform some calculation, then place their output (if any) on another channel. Output plugins just receive these values and output them, e.g. to stdout. In the example above, the output plugin creates a new graphite metric.
In the example shown above, the analysis plugin emits a new metric (orange) when the input metric falls outside three standard deviations of its prior values. This is a simple statistical technique known as three sigma that is useful for data with a normal distribution.
Channels and goroutines mean we can construct parallel analysis pipelines with very little effort. Each plugin runs in its own goroutine, and shares data with channels. As well as easy concurrency, another advantage of using Go is being able to supply a single binary to users.
The obvious shortcoming of using Go is lack of prior work in this area. In particular, there aren’t many statistical packages for Go, though I was able to find the packages I needed for simple calculations. Damian Gryski and others have also done significant work in this area.
Future work
Anode is an experiment, thrown together in a few evenings to see how difficult it would be to write the software I envisioned for experimenting with anomaly detection. There’s lots to do to make this a more useful experimental tool.
The first job is clear: more analysis algorithms and output options. Input plugins for different metrics storage backends will also be needed.
The second area is a little less well-specified: a user-configurable system for pipelines. At the moment, anode just runs a single analysis plugin (specified in main.go) to demonstrate that it works.
Looking further ahead, one of the things which makes Heka an interesting project is the embedded Lua sandbox, which allows plugin changes to be made dynamically. It’d be great to have similar functionality for metrics analysis.
Ultimately, it may be that anode becomes a configurable subsystem of a project like Heka, reusing the efforts that have gone into more stable projects. For now, it works well as a standalone project where we can move quickly and break things if needed.
I hope this has provided an interesting introduction to anomaly detection in Go. If you’re interested in working on anode or are working on a project in this area, do get in touch via twitter or send me an email.