Avoiding high GC overhead with large heaps
The Go Garbage Collector (GC) works exceptionally well when the amount of memory allocated is relatively small, but with larger heap sizes the GC can end up using considerable amounts of CPU. In extreme cases it can fail to keep up.
What’s the problem?
The GC’s job is to work out which pieces of memory are available to be freed, and it does this by scanning through memory looking for pointers to memory allocations. To put it simply, if there are no pointers to an allocation then the allocation can be freed. This works very well, but the more memory there is to scan the more time it takes.
Suppose you’ve written an in-memory database, or you’re building a data pipeline that needs a huge lookup table. In those scenarios, you may have Gigabytes of memory allocated. In this case, you may be losing quite a bit of potential performance to the GC.
Is it a big problem?
How much of a problem? Let’s find out! Here’s a tiny program to demonstrate. We allocate a billion (1e9) 8 byte pointers, so approximately 8 GB of memory. We then force a GC and time how long it takes. And we do that a few times to get a steady value. We also call runtime.KeepAlive() to ensure the GC/compiler doesn’t throw away our allocation in the meantime.
|
|
On my 2015 MBP I get the following output.
1 2 3 4 5 6 7 8 9 10 |
GC took 4.275752421s GC took 1.465274593s GC took 652.591348ms GC took 648.295749ms GC took 574.027934ms GC took 560.615987ms GC took 555.199337ms GC took 1.071215002s GC took 544.226187ms GC took 545.682881ms |
The GC takes over half a second. And why should that be surprising? I’ve allocated 1 billion pointers. That’s actually less than a nano-second per pointer to check each pointer. Which is a pretty good speed for looking at pointers.
So what next?
That seems like a fundamental problem. If our application needs a large in-memory lookup table, or if our application fundamentally is a large in-memory lookup table, then we’ve got a problem. If the GC insists on periodically scanning all the memory we’ve allocated we’ll lose huge amounts of the available processing power to the GC. What can we do about this?
We essentially have two choices. We either hide the memory from the GC, or make it uninteresting to the GC.
Make our memory dull
How can memory be uninteresting? Well, the GC is looking for pointers. What if the type of our allocated object doesn’t contain pointers? Will the GC still scan it?
We can try that. In the below example we’re allocating exactly the same amount of memory as before, but now our allocation has no pointer types in it. We allocate a slice of a billion 8-byte ints, again this is approximately 8GB of memory.
|
|
Again, I’ve run this on my 2015 MBP
1 2 3 4 5 6 7 8 9 10 |
GC took 350.941µs GC took 179.517µs GC took 169.442µs GC took 191.353µs GC took 126.585µs GC took 127.504µs GC took 111.425µs GC took 163.378µs GC took 145.257µs GC took 144.757µs |
The GC is considerably more than 1000 times faster, for exactly the same amount of memory allocated. It turns out that the Go memory manager knows what types each allocation is for, and will mark allocations that do not contain pointers so that the GC does not have to scan them. If we can arrange for our in-memory tables to have no pointers, then we’re on to a winner.
Keep our memory hidden
The other thing we can do is hide the allocations from the GC. If we ask the OS for memory directly, the GC never finds out about it, and therefore does not scan it. Doing this is a little more involved than our previous example!
Here’s the equivalent of our first program where we allocate a []*int with a billion (1e9) entries. This time, we use the mmap syscall to ask for the memory directly from the OS kernel. Note this only works on unix-like operating systems, but there are similar things you can do on Windows.
|
|
Here’s the output.
1 2 3 4 5 6 7 8 9 10 |
GC took 460.777µs GC took 206.805µs GC took 174.58µs GC took 193.697µs GC took 184.325µs GC took 142.556µs GC took 132.48µs GC took 155.853µs GC took 138.54µs GC took 159.04µs |
(Want to understand a := *(*[]*int)(unsafe.Pointer(&slice))? Take a look at https://blog.gopheracademy.com/advent-2017/unsafe-pointer-and-system-calls/)
Now, the memory here is invisible to the GC. This has the interesting consequence that pointers stored in this memory won’t stop any ‘normal’ allocations they point to from being collected by the GC. And this has bad consequences, which are tragically easy to demonstrate.
Here we try to store the numbers 0, 1 & 2 in heap-allocated ints, and store pointers to them in our off-heap mmap-allocated slice. We force a GC after allocating and storing a pointer to each int.
|
|
And here’s our output. The memory backing our ints is freed up and potentially re-used after each GC. So our data is not as we expected and we’re lucky not to crash.
1 2 3 4 5 6 7 8 9 10 |
a[0] is C000016090 *a[0] is 0 a[1] is C00008C030 *a[1] is 1 a[2] is C00008C030 *a[2] is 2 *a[0] is 0 *a[1] is 811295018 *a[2] is 811295018 |
Not good. If we alter this to use a normally allocated []*int as follows we get the expected result.
|
|
1 2 3 4 5 6 7 8 9 10 |
a[0] is C00009A000 *a[0] is 0 a[1] is C00009A040 *a[1] is 1 a[2] is C00009A050 *a[2] is 2 *a[0] is 0 *a[1] is 1 *a[2] is 2 |
The nub of the problem
So, it turns out that pointers are the enemy, both when we have large amounts of memory allocated on-heap, and when we try to work around this by moving the data to our own off-heap allocations. If we can avoid any pointers within the types we’re allocating they won’t cause GC overhead, so we won’t need to use any off-heap tricks. If we do use off-heap allocations, then we need to avoid storing pointers to heap allocations unless these are also referenced by memory that is visible to the GC.
How can we avoid pointers?
In large heaps, pointers are evil and must be avoided. But you need to be able to spot them to avoid them, and they aren’t always obvious. Strings, slices and time.Time all contain pointers. If you store a lot of these in memory it may be necessary to take some steps.
When I’ve had issues with large heaps the major causes have been the following.
- Lots of strings
- Timestamps on objects using time.Time
- Maps with slice values
- Maps with string keys
There’s a lot to say about different strategies to deal with each of these. In this post I’ll just talk about one idea for dealing with strings.
Strings
What is a string? Well, there are two parts to it. There’s the string header, which tells you how long it is, and where the underlying data is. And then there’s the underlying data, which is just a sequence of bytes.
When you pass a string variable to a function it is the string header that gets written to the stack, and if you keep a slice of strings, it is the string headers that appear in the slice.
The string header is described by reflect.StringHeader, which looks like the following.
|
|
String headers contain pointers, so we want to avoid storing strings!
- If your string takes only a few fixed values then consider using integer constants instead
- If you are storing dates and times as strings, then perhaps parse them and store the date or time as an integer
- If you fundamentally need to keep hold of a lot of strings then read on…
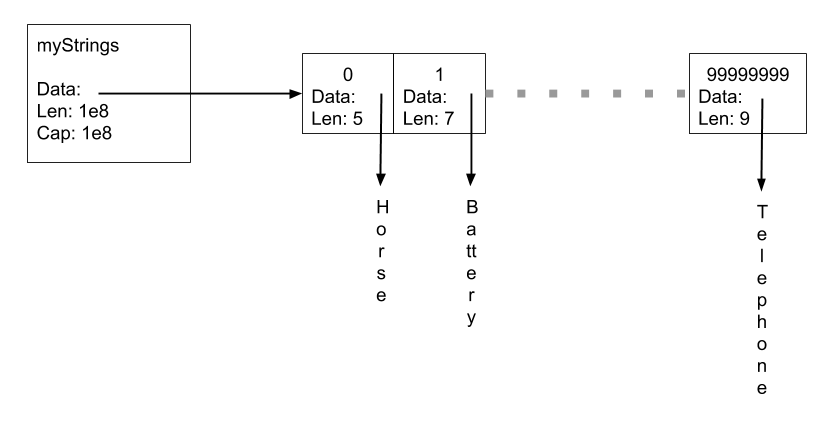
Let’s say we’re storing a hundred million strings. For simplicity, lets assume this is a single huge global var mystrings []string.
What do we have here? Underlying mystrings is a reflect.SliceHeader, which looks similar to the reflect.StringHeader we’ve just seen.
|
|
For mystrings Len and Cap will each be 100,000,000, and Data will point to a contiguous piece of memory large enough to contain 100,000,000 StringHeaders. That piece of memory contains pointers and hence will be scanned by the GC.
The strings themselves comprise two pieces. The StringHeaders that are contained in this slice, and the Data for each string, which are separate allocations, none of which can contain pointers. It’s the string headers which are a problem from a GC point of view, not the string data itself. The string data contains no pointers so is not scanned. The huge array of string headers does contain pointers, so must be scanned on every GC cycle.

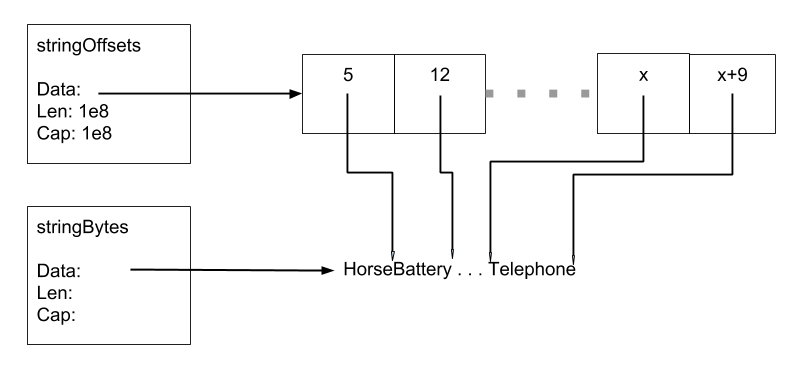
What can we do about this? Well, if all the string bytes were in a single piece of memory, we could track the strings by offsets to the start and end of each string in this memory. By tracking offsets we no-longer have pointers in our large slice, and the GC is no longer troubled.

What we give up by doing this is the ability to free up memory for individual strings, and we’ve added some overhead copying the string bodies into our big byte slice.
Here’s a small program to demonstrate the idea. We’ll create 100,000,000 strings, copy the bytes from the strings into a single big byte slice, and store the offsets. We’ll then show the GC time is still small, and demonstrate that we can retrieve the strings by showing the first 10.
|
|
1 2 3 4 5 6 7 8 9 10 11 |
GC took 187.082µs 0 1 2 3 4 5 6 7 8 9 |
The principle here is that if you never need to free a string, you can convert it to an index into a larger block of data and avoid having large numbers of pointers. I’ve built a slightly more sophisticated thing that follows this principle here if you are interested.
I’ve blogged before about running into Garbage Collector (GC) problems caused by large heaps. Quite a few times. In fact every time I’ve hit this problem I’ve managed to be surprised, and in my shock I’ve blogged about it again. Hopefully by reading this far you won’t be surprised if it happens to your projects, or perhaps you’ll even anticipate the problem!
Here are some resources that you might find helpful dealing with these issues.
- The string store I mentioned above
- A string interning library that stores strings in a stringbank and ensures they are unique
- A variation that converts between unique strings in a stringbank and sequence numbers that can be used to index into an array.
